Population Density...
Ellsworth has a population density of about 88 people per square miles. There has been a 5% loss in growth as of 2010, but it seems that those who live here, do establish residency for long periods of time. There is a 50% rate of individuals that have lived here for 5 or more years. They have an average of a 14% yearly residential turnover. As far as migration goes from the residents of Ellsworth, below is a list to show you were the residents came from, before living here.
Ellsworth has a population density of about 88 people per square miles. There has been a 5% loss in growth as of 2010, but it seems that those who live here, do establish residency for long periods of time. There is a 50% rate of individuals that have lived here for 5 or more years. They have an average of a 14% yearly residential turnover. As far as migration goes from the residents of Ellsworth, below is a list to show you were the residents came from, before living here.
Ohio: 1919
Northeast: 172
Midwest: 53
South: 70
West: 0
Northeast: 172
Midwest: 53
South: 70
West: 0
Population Composition...
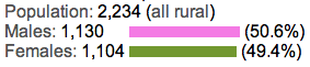
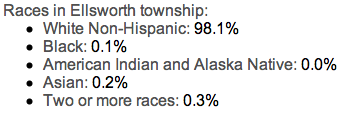
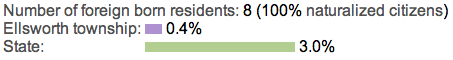
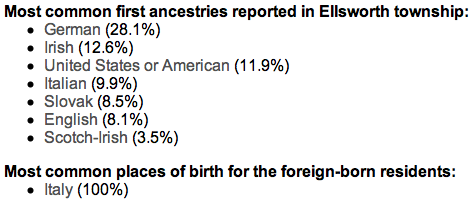
Ellsworth is home to 2,234 residents of which 1,130 are males, and 1,104 are females. The average age of males here is 42.0 years old, and females came in with an average of 42.1 years old. This town is predominantly of the White (non-hispanic) race. 98.1% of its residents are of that race, whereas the next closest race is Asian at only 0.2%. Then there are Blacks who make up 0.1% of the population, and lastly 0.3% of the population are two or more races. This also backs up the fact that there are only 8 foreign-born residents out of the entire town of whom all were born in Italy. When you take a look at ethnicities, Germans top the list at 28.1%. This is then followed by the nest two highest ethnicities as Irish and United States/American.
Ellsworth is home to 2,234 residents of which 1,130 are males, and 1,104 are females. The average age of males here is 42.0 years old, and females came in with an average of 42.1 years old. This town is predominantly of the White (non-hispanic) race. 98.1% of its residents are of that race, whereas the next closest race is Asian at only 0.2%. Then there are Blacks who make up 0.1% of the population, and lastly 0.3% of the population are two or more races. This also backs up the fact that there are only 8 foreign-born residents out of the entire town of whom all were born in Italy. When you take a look at ethnicities, Germans top the list at 28.1%. This is then followed by the nest two highest ethnicities as Irish and United States/American.
|
|
Population Characteristics...
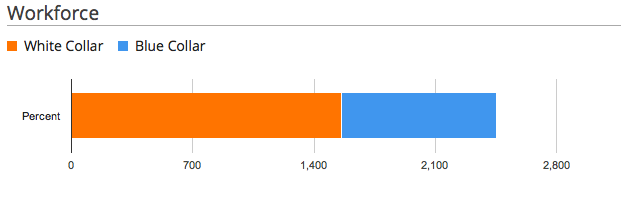
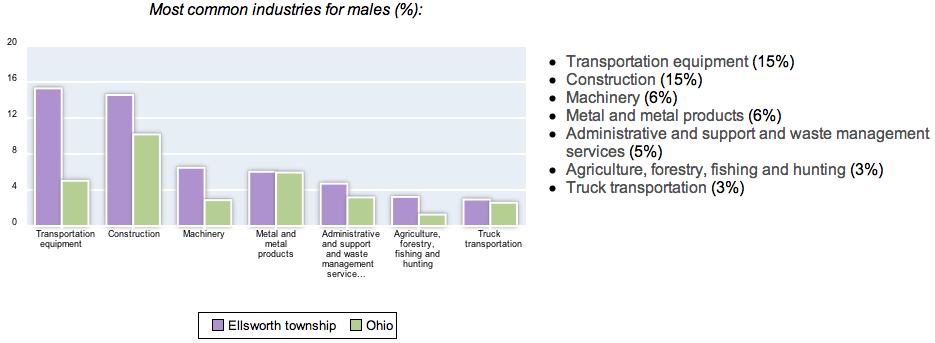
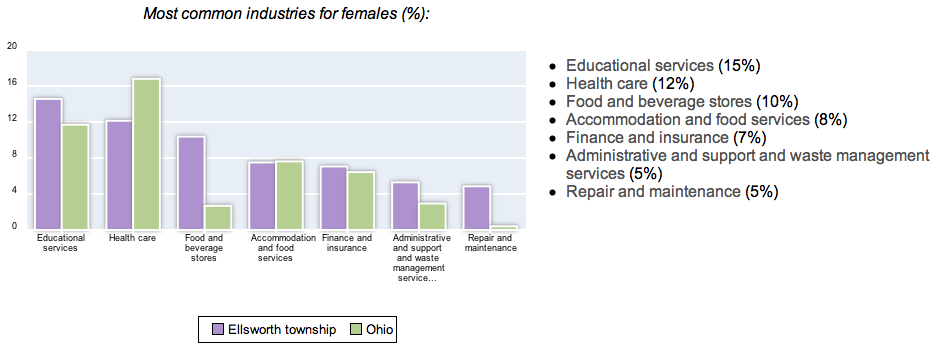
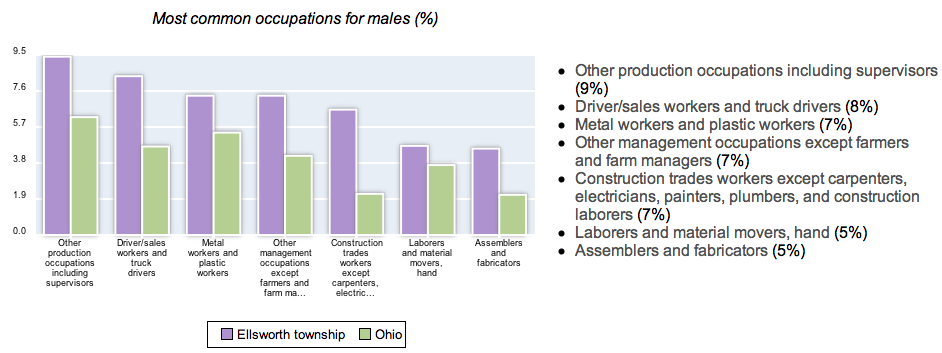
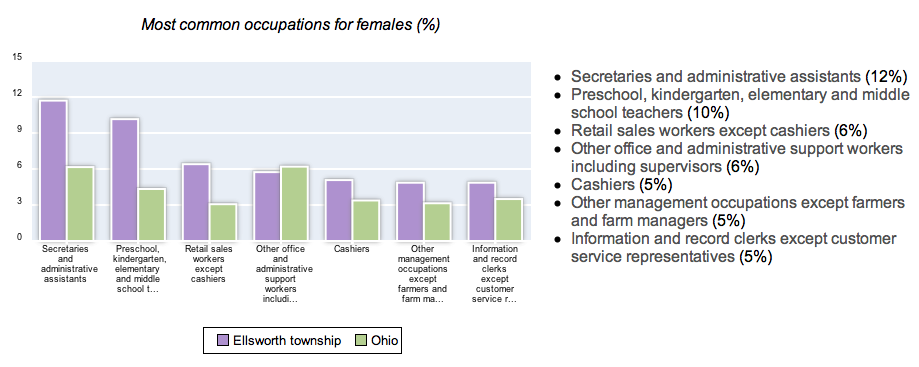
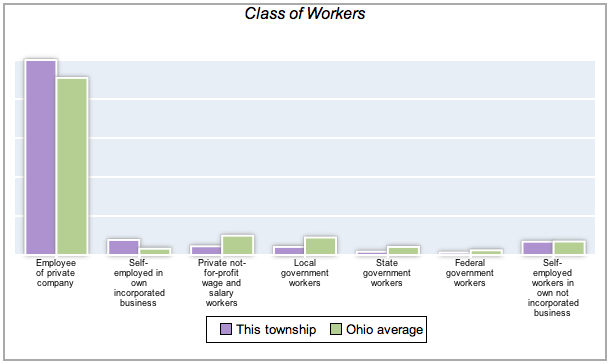
Ellsworth as a whole falls under the socioeconomic status of middle class. There are approximately 2.5 times more white collar workers than their blue collar counterparts. Most individuals work for a privately owned company, followed by those who are self employed in their own incorporated and not in their own incorporated businesses. Men seem to be working mostly in construction and also in the transportation industry. Women, however, seem to find themselves in secretarial/office jobs or in educational services as teachers. Women also have a strong following in the health care field. Most of the occupations and positions I mentioned are higher than the Ohio average with an exception to health care. Below are some charts and graphs that compare the averages of Ellsworth to those of Ohio. You are able to see the more popular occupation industries for both men and women.
Ellsworth as a whole falls under the socioeconomic status of middle class. There are approximately 2.5 times more white collar workers than their blue collar counterparts. Most individuals work for a privately owned company, followed by those who are self employed in their own incorporated and not in their own incorporated businesses. Men seem to be working mostly in construction and also in the transportation industry. Women, however, seem to find themselves in secretarial/office jobs or in educational services as teachers. Women also have a strong following in the health care field. Most of the occupations and positions I mentioned are higher than the Ohio average with an exception to health care. Below are some charts and graphs that compare the averages of Ellsworth to those of Ohio. You are able to see the more popular occupation industries for both men and women.
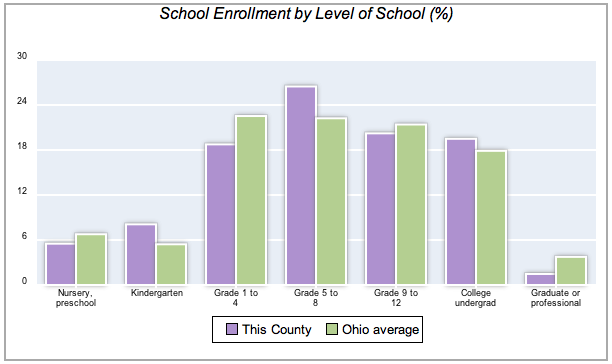
Education seems to be very similar to that of the Ohio average. Approximately 7% of the residents have not graduated from high school. There are 29.4% of people with their high school diploma, 21.9% have went on to get a college degree, and 4.4% of those individuals have a graduate degree from college. One category that was promising when looking at the charts is the fact that Ellsworth's (about 20%) percent of students in undergraduate college programs is higher than that of Ohio's (about 18%).

Taking a look at the marriage and divorce rate, the information was gathered in order to see what percent of Mahoning County made up the marriages and divorces for the whole state of Ohio. Ohio had 39,524 divorces and Mahoning County made up 637 of those. That means Mahoning County only made up about 1.6% of the total divorces in the state. Ohio also had 66,433 marriages, and Mahoning County played a part in about 1,071 of those. This shows that Mahoning County, yet again, accounted for about 1.6% of the total marriages as well.
Looking at the dynamics of households, we uncovered that there are 565 male householders and only 97 female householders who had a combined total of 706 children. Then there are those who live in a non-family household who had 193 male householders, and 104 female householders. Looking at all of the homes previously mentioned, there are 424 married couples with children. Ellsworth also has 50 single-parent households of which 18 are men and the remaining 32 are women. All of the statistics include blended families, and those families who adopted children as well. Mahoning county had a crude birth rate of 10.1, comparing that to Ohio's rate of 12.1.
Looking at the dynamics of households, we uncovered that there are 565 male householders and only 97 female householders who had a combined total of 706 children. Then there are those who live in a non-family household who had 193 male householders, and 104 female householders. Looking at all of the homes previously mentioned, there are 424 married couples with children. Ellsworth also has 50 single-parent households of which 18 are men and the remaining 32 are women. All of the statistics include blended families, and those families who adopted children as well. Mahoning county had a crude birth rate of 10.1, comparing that to Ohio's rate of 12.1.
There is a median income for households in Ellsworth of $57,282. This is much higher than that of Ohio's whose sets at about $45,395. These numbers also reflect those individuals who fall below the poverty line. 3.2% of people living in Ellsworth fall below that line, whereas 10.6% of Ohioans are considered to be living in poverty. There was also another statistic that was analyzed and that was individuals who fell 50% below the poverty level. There were 0% of Ellsworth residents that fell into this category, but there were 4.8% of Ohio residents that did.
Mortality Characteristics...
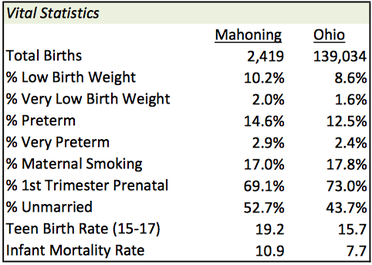
The crude death rate for the United States was 8 deaths per 1,000 people in 2012.The infant mortality rate for the county comes in at 6.94, and for Ohio it stands at a 7.9 deaths per 1,000 live births. Below is included a chart that gives you a little bit more information regarding births in Mahoning County and Ohio. There were a total of 2,419 births in Mahoning County, but there were 139,034 in Ohio. it also includes percentages where some mothers engaged in high-risk behaviors during their pregnancy, as well as an ever-growing topic of teen pregnancies. Although some involved themselves in such behaviors, 1,569 pregnant women did have prenatal care during their first trimester accounting for 69.1% of them. The maternal mortality rate for Ohio in 2010 was 15 deaths per 100,000 births which is higher than the national average of 13 deaths per 100,000 births.
The crude death rate for the United States was 8 deaths per 1,000 people in 2012.The infant mortality rate for the county comes in at 6.94, and for Ohio it stands at a 7.9 deaths per 1,000 live births. Below is included a chart that gives you a little bit more information regarding births in Mahoning County and Ohio. There were a total of 2,419 births in Mahoning County, but there were 139,034 in Ohio. it also includes percentages where some mothers engaged in high-risk behaviors during their pregnancy, as well as an ever-growing topic of teen pregnancies. Although some involved themselves in such behaviors, 1,569 pregnant women did have prenatal care during their first trimester accounting for 69.1% of them. The maternal mortality rate for Ohio in 2010 was 15 deaths per 100,000 births which is higher than the national average of 13 deaths per 100,000 births.
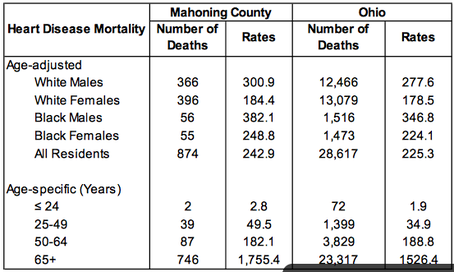
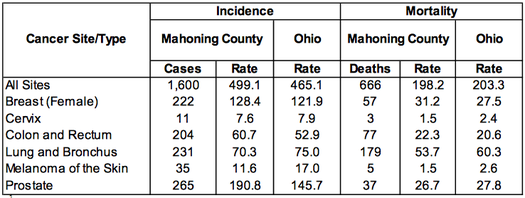
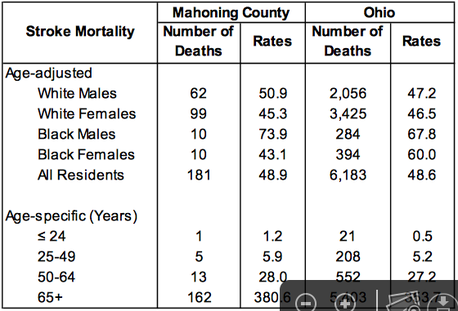
We analyzed the top 6 diseases that seemed to have the most prevalence not only in Mahoning County, but in Ohio as well. Just below is a list displaying how many deaths each of those diseases caused in the county and for the whole state. Following that, there are the top 3 killers, that break it down even further for you into the race and rates as well.
Disease Mahoning County Ohio
Heart DIsease 874 28,617
Cancer 675 24,825
Stroke 181 3,717
Chr. Respiratory 143 6,170
Diabetes Mellitus 94 4,173
Unintentional Injury 93 6,183
Heart DIsease 874 28,617
Cancer 675 24,825
Stroke 181 3,717
Chr. Respiratory 143 6,170
Diabetes Mellitus 94 4,173
Unintentional Injury 93 6,183
Morbidity Characteristics...
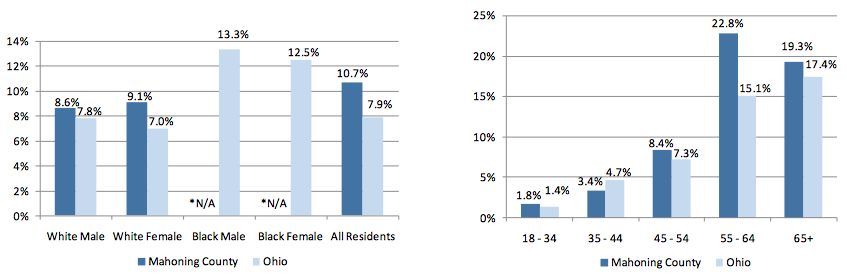
When taking a look at some of the diseases that were common among the population, I found that they were closely related to those that caused a majority of the deaths. Cholesterol and blood pressure seemed to act as the building blocks for the development of other diseases. 41.9% of the population reported that they have been told that they had high cholesterol, whereas 29.5% reported they were told they had high blood pressure. Heart attacks, Coronary Artery DIsease, Stroke, and Cancer all played the most prevalent roles in disease in Mahoning County; 5.7% reported that they had a previous heart attack, 5.3% reported the had Coronary Artery Disease, 2.9% reported they have had a Stroke, and there were 1600 cases of cancer just in Mahoning County alone. The prevalence of Diabetes and Pre-Diabetes is also on the rise. Mahoning County has a higher rate than compared to Ohio in nearly almost every race and age category. Below shows a graph comparing the estimated prevalence of Diabetes in both Ohio and Mahoning County.
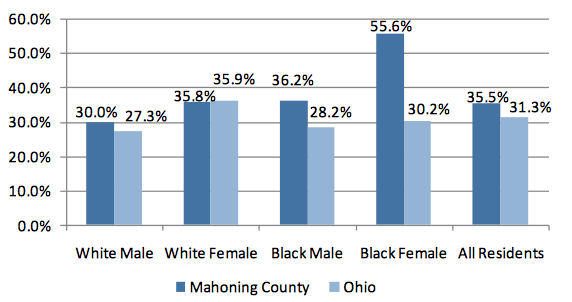
Arthritis also seems to be a growing concern regarding the morbidity of the local population, and is the most common cause of disability among the United States. It is reported that there are approximately 35.5% of adults diagnosed with arthritis just in Mahoning County. They fall on the high end of the spectrum as one of the leading counties in arthritis prevalence. In terms of total residents, this county has a higher rate of incidence than the state average by 4.2%. The graph below shows the the estimated prevalence (percent) of arthritis in Mahoning County and the state of Ohio.
Strengths
- Household income is higher than that of the state median income.
- They had a high percentage of high school graduates.
- Much lower rate of poverty than Ohio.
- Close knit community.
- They have a low unemployment rate.
Weaknesses
- Very minimal diversity in regards to ethnicity and culture.
- Higher rate of low birth weight newborns.
- Higher rate of infant mortality, and preterm infants.
- Mostly employed by private industries.
- Higher rates of mortality for specific diseases than the Ohio rate.
References
- http://www.northwood.com/Community/OH/ELLSWORTH/Demographics/
- http://www.odh.ohio.gov/healthstats/vitalstats/mrdvstat.aspx
- http://www.healthy.ohio.gov/comprofiles/mahoning.pdf
- http://www.helpmegrow.ohio.gov/aboutus/data/countycards/~/media/9CC68A8744A646DAB281A4F9C46C458E.ashx
- http://mahoning.oh.networkofcare.org/ph/indicator_detail.aspx?id=inf_mort_oh&c=2
- http://www.census.gov/sdc/ohsdc.html
- http://quickfacts.census.gov/qfd/states/39/39099.html
- http://jfs.ohio.gov/county/cntypro/pdf13/Mahoning.stm
